CMS

Introduction
The term Content Management System (CMS) refers to systems enabling individuals and organizations to create, manage, and publish content. A CMS for web content, specifically, is a system aimed at creating, managing, and publishing content to be consumed and experienced via the internet.
Each CMS implements some subset of a wide range of content management capabilities and the corresponding mechanisms for users to build websites easily and effectively around their content. Content is often stored in a type of database, providing users with the flexibility to reuse it wherever needed for their content strategy. CMSs also provide administrative capabilities aimed at making it easy for users to upload and manage content as needed.
There is great variability on the type and scope of the support CMSs provide for building sites; some provide ready-to-use templates which are supplemented with user content, and others require much more user involvement for designing and constructing the site structure.
When we think about CMSs, we need to account for all the components that play a role in the viability of such a system for providing a platform for publishing content on the web. All of these components form an ecosystem surrounding the CMS platform, and they include hosting providers, extension developers, development agencies, site builders, etc. Thus, when we talk about a CMS, we usually refer to both the platform itself and its surrounding ecosystem.
There are many interesting and important aspects to analyze and questions to answer in our quest to understand the CMS space and its role in the present and the future of the web. We acknowledge the vastness and complexity of the CMS platforms space and bring to it our curiosity along with deep expertise on some of the major players in the space.
In this chapter, we seek to help understand the current state of the CMS ecosystems, the role they play in shaping users’ perception of how content can be consumed and experienced on the web, and their impact on the environment. Our goal is to discuss aspects related to the CMS landscape in general, and the characteristics of web pages generated by these systems.
This second edition of the Web Almanac builds on last year’s work. We now have the benefit of being able to compare the 2020 results to 2019 in order to start establishing trends. Let’s dive into our analysis.
Why use a CMS in 2020?
People and organizations use a CMS in 2020 as in many cases CMSs offer a shortcut to creating a website which meets their needs. As we’ll discuss later, there are both general and specialized CMSs. The general CMSs are often extensible through add-ons, and the specialized CMSs are often focused on specific industry needs or functionality.
Whichever CMS used, it is in use because it solves a problem for the user or organization. It’s beyond our scope to explore why each CMS is chosen, but later we do explore why the most popular CMS, WordPress, is disproportionately chosen.
CMS adoption
Our analysis throughout this work looks at desktop and mobile websites. The vast majority of URLs we looked at are in both datasets, but some URLs are only accessed by desktop or mobile devices. This can cause small divergences in the data, and we thus look at desktop and mobile results separately.
More than 42% of web pages are powered by a CMS platform, an increase of over 5% from 2019. This breaks down to 42.18% on desktop, up from 40.01% in 2019, and 42.27% on mobile, up from 39.61% in 2019.
| Year | Desktop | Mobile |
|---|---|---|
| 2019 | 39.61% | 40.01% |
| 2020 | 42.27% | 42.18% |
| % Change | 6.71% | 5.43% |
The increase in desktop web pages powered by a CMS platform is 5.43% from last year. On mobile this increase is roughly a quarter higher, at 6.71%.
As with last year, we see different results from other datasets for tracking market share of CMS platforms, such as W3Techs. W3Techs reports at the time of writing that 60.6% of web pages are created by CMSs, up from 56.4% a year ago. This is a 6.4% increase, which broadly matches our findings.
The deviation between our analysis and W3Techs’ analysis can be explained by a difference in research methodologies. You can read more about ours on the Methodology page.
Our research identified 222 individual CMSs, with these ranging from a single install to millions on a single CMS.
Some of them are open source (e.g. WordPress, Joomla, others) and some of them are proprietary (e.g. Wix, Squarespace, others). As we’ll discuss later, the top 3 CMSs by adoption share are all open source, but proprietary platforms have seen large increases in adoption share this year. Some CMS platforms can be used on “free” hosted or self-hosted plans, and there are also options for using these platforms on higher-tiered plans even at the enterprise level.
The CMS space as a whole is a complex, federated universe of CMS ecosystems, all separated and at the same time intertwined. Our research shows CMSs are only getting more important. The minimum of 5% increase in adoption of CMSs shows that in a year when COVID-19 has created immense uncertainty, solid CMS platforms have provided some stability. As we discussed last year, these platforms play a key role for us to succeed in our collective quest for an evergreen, healthy, and vibrant web. This has become truer since, and we expect it to continue to be the case going forward.
Top CMSs
Our analysis counted 222 separate CMSs. While this is a high count, 204 (92%) of these have an adoption share of 0.01% or lower. This leaves only 13 CMSs with an adoption share of between 0.1 and 1%, and four with a share of between 1 and 2%, and one with a share over this.
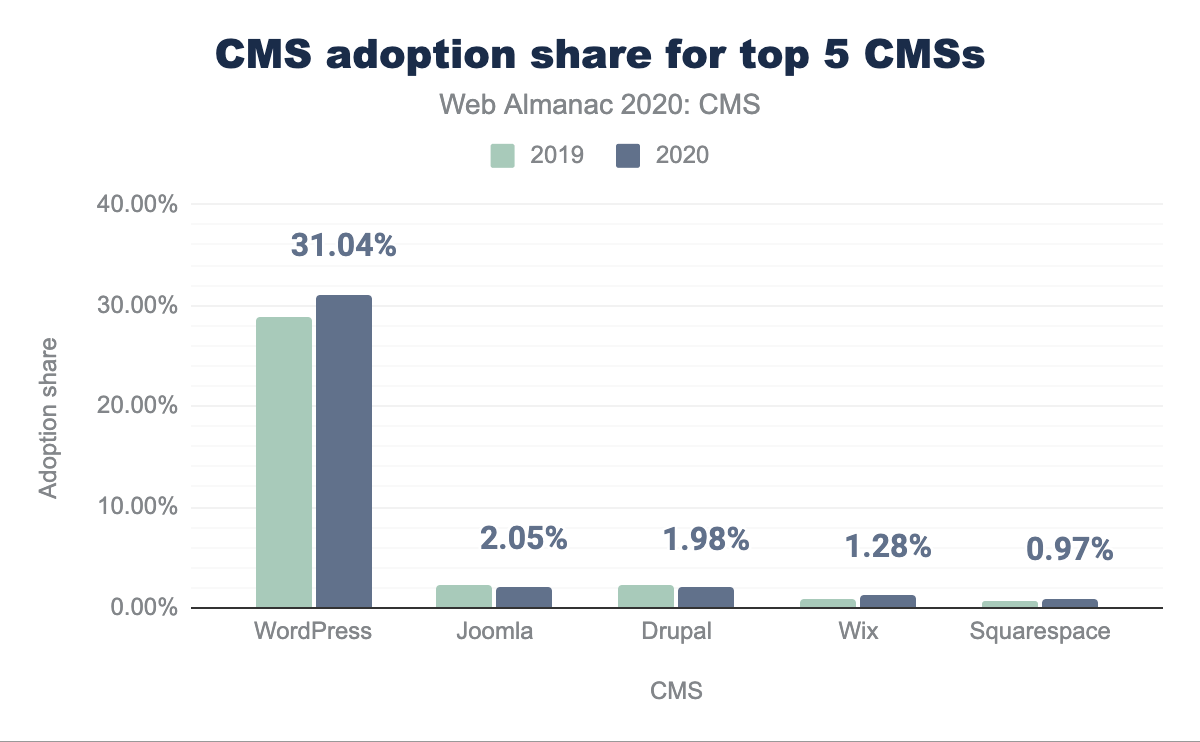
The one CMS with a share over 2% is WordPress, which has a 31% usage share. This is over 15 times the share of the next most popular CMS, Joomla:
Joomla and Drupal have lost 8% and 10% of their adoption share respectively, whilst Wix and Squarespace have gained an extra 41% and 28% adoption share respectively. WordPress has gained an extra 7% adoption share in the last year, which is a larger absolute increase than the total share for Joomla, the next most popular CMS.
These numbers are broadly consistent when split across desktop and mobile:
For WordPress the numbers are very similar; for the other CMSs the difference is larger. Drupal and Squarespace have 16.7 and 26.3% more websites on desktop than mobile respectively, whilst Joomla and Wix have 7.5 and 15.2% more times on mobile than desktop.
The 0.1 to 1% adoption share category sees significantly more movement. These account for CMSs powering up to 50,000 websites.
| CMS | 2019 | 2020 | % change |
|---|---|---|---|
| WordPress | 28.91% | 31.04% | 7% |
| Joomla | 2.24% | 2.05% | -8% |
| Drupal | 2.21% | 1.98% | -10% |
| Wix | 0.91% | 1.28% | 41% |
| Squarespace | 0.76% | 0.97% | 28% |
| 1C-Bitrix | 0.55% | 0.61% | 10% |
| TYPO3 CMS | 0.53% | 0.52% | -2% |
| Weebly | 0.39% | 0.33% | -15% |
| Jimdo | 0.28% | 0.24% | -16% |
| Adobe Experience Manager | 0.27% | 0.23% | -14% |
| Duda | 0.22% | ||
| GoDaddy Website Builder | 0.18% | ||
| DNN | 0.20% | 0.16% | -19% |
| DataLife Engine | 0.19% | 0.16% | -12% |
| Tilda | 0.08% | 0.16% | 100% |
| Liferay | 0.12% | 0.11% | -10% |
| Microsoft SharePoint | 0.15% | 0.11% | -25% |
| Kentico CMS | 0.00% | 0.11% | 10819% |
| Contao | 0.09% | 0.09% | 0% |
| Craft CMS | 0.08% | 0.09% | 5% |
| MyWebsite | 0.09% | ||
| Concrete5 | 0.10% | 0.09% | -12% |
We see three new entrants here: Duda, GoDaddy Website Builder, and MyWebsite. Two, Tilda and Kentico CMS, have seen an adoption share change of over 100% in the last year. This “long tail” of CMSs cover a mix of open source and proprietary platforms and include everything from consumer-friendly to industry-specific. An incredible strength of the CMS platforms as a whole is one can get specialized software which powers every conceivable type of website.
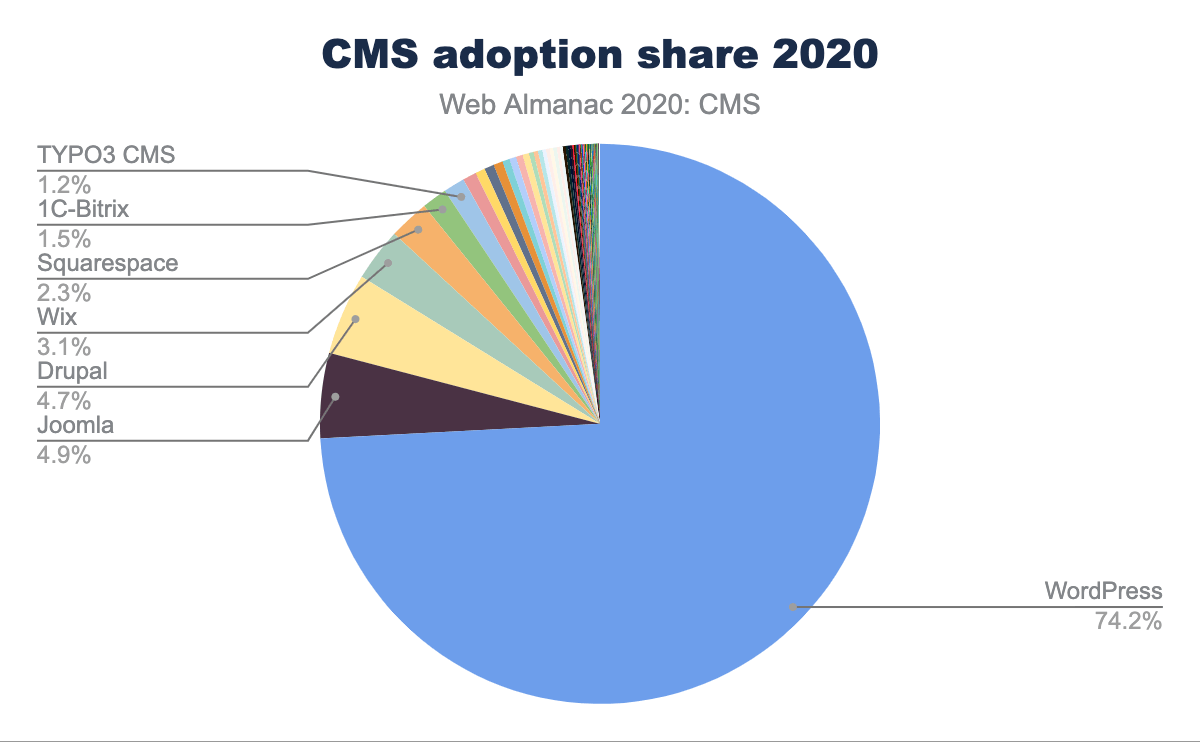
When we look at CMS adoption share relative to other CMSs (thus excluding websites with no CMS), The dominance of WordPress becomes clear. The adoption share of websites with a CMS is 74.2%. With these numbers relative, Joomla, Drupal, Wix, and Squarespace receive higher adoption rates: 4.9%, 4.7%, 3.1%, and 2.3% respectively:
WordPress usage
WordPress dominates this space and thus deserves further discussion.
WordPress is an open source project with a mission to “democratize publishing”. The CMS is free. While this is likely an important factor in its adoption share, the two next most popular CMSs–Joomla and Drupal–are also free. The WordPress community, contributors, and business ecosystem are likely the major differentiators.
A “core” WordPress community maintains the CMS and services requirements for additional functionality through custom services and products (themes and plugins). This community has an outsized impact, with a relatively small number of people maintaining both the CMS itself and providing the additional functionality which makes WordPress sufficiently powerful and flexible that it can service most types of website. This flexibility is important when explaining the market share.
Deriving from this flexibility, WordPress also has a low barrier of entry for developers and site “builders” or “implementers”. We see a virtuous cycle: flexible extensions offer ever-easier site building, which lets more and more users build ever-more-powerful sites with WordPress. This increase in users makes it more attractive for developers to create better and better extensions, furthering the cycle.
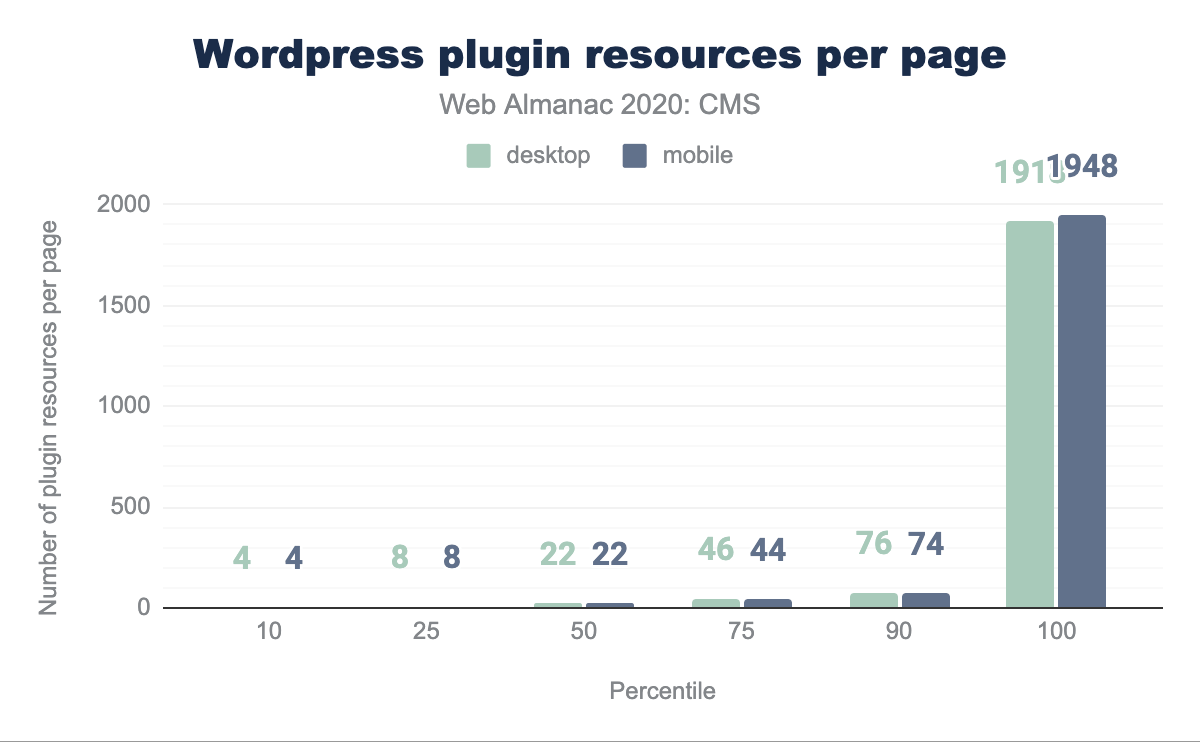
We explored how WordPress sites use these extensions, which are typically WordPress plugins. The median WordPress site (on desktop and mobile) loads 22 plugin resources per page, with sites at the 90th percentile loading 76 and 74 resources per page on desktop and mobile respectively. At the 100th percentile this goes as high as 1918 and 1948 resources per page on desktop and mobile respectively. Whilst we can’t compare this to other CMSs, it seems likely that WordPress’s extension ecosystem is a major contributor to its high adoption rate.
WordPress’s adoption share growth of 7.40% from 2019 to 2020 outstrips the overall increase in adoption of CMSs as a whole. This suggests WordPress has appeal significantly beyond the “average” CMS.
2020 has seen the impact of COVID-19. This may explain the increase in market share. Anecdotally, we can suggest that with many physical businesses closing permanently or temporarily, there has been increased demand for websites in general and WordPress as the largest CMS has benefited from this. Further research in the coming years will be required to ascertain the full impact.
With the adoption share of CMSs explored, let’s now turn our attention to user experience.
CMS user experience
CMSs must offer a good user experience. With so much of the web relying on CMSs to serve pages, it is the responsibility of the CMS at the platform-level to ensure the user experience is good. Our aim is to shed light on real-world user experience when using CMS-powered websites.
To achieve this, we turn our analysis towards some user-perceived performance metrics, which are captured in the three Core Web Vitals metrics, as well as the Lighthouse scores in the SEO and Accessibility categories.
Chrome User Experience Report
In this section we take a look at three important factors provided by the Chrome User Experience Report, which can shed light on our understanding of how users are experiencing CMS-powered web pages in the wild:
- Largest Contentful Paint (LCP)
- First Input Delay (FID)
- Cumulative Layout Shift (CLS)
These metrics aim to cover the core elements which are indicative of a great web user experience. The Performance chapter will cover these in more detail, but here we are interested in looking at these metrics specifically in terms of CMSs. Let’s review each of these in turn.
Largest Contentful Paint
Largest Contentful Paint (LCP) measures the point when the page’s main content has likely loaded and thus the page is useful to the user. It does this by measuring the render time of the largest image or text block visible within the viewport.
This is different to First Contentful Pain (FCP), which measures from page load until content such as text or an image is first displayed. LCP is regarded as a good proxy for measuring when the main content of a page is loaded.
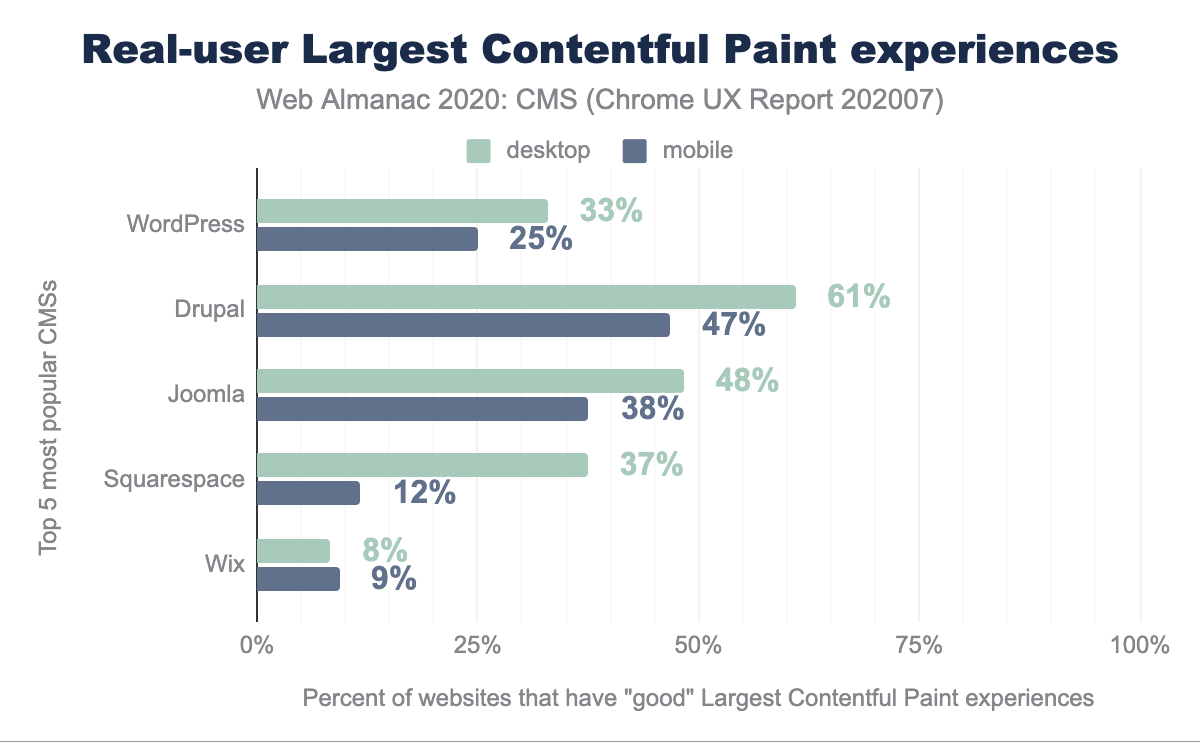
A “good” LCP is regarded as under 2.5 seconds. The average website on one of the top five CMSs does not have a good LCP. Only Drupal on desktop scores over 50% here. We see major discrepancies between desktop and mobile scores: WordPress is fairly even at 33% on desktop and 25% on mobile, but Squarespace scores 37% on desktop and only 12% on mobile.
Even though we’d love to see CMSs performing much better here, there are still some positive takeaways from these results. For one, the fact that 61% of Drupal websites have good LCP is especially notable because it’s much better than the global distribution of 48% of websites having good LCP, according to the Chrome UX Report. For 1 in 3 or 4 WordPress websites to have good LCP is also kind of amazing, given the sheer magnitude of the number of WordPress websites. Wix does have some catching up to do, but it’s encouraging to see that Wix engineers are actively working on fixing performance issues, so this will be something to keep an eye on over the years.
First Input Delay
First Input Delay (FID) measures the time from when a user first interacts with your site (i.e. when they click a link, tap on a button, or use a custom, JavaScript-powered control) to the time when the browser is actually able to respond to that interaction. A “fast” FID from a user’s perspective would be immediate feedback from their actions on a site rather than a stalled experience. Any delay is a pain point and could correlate with interference from other aspects of the site loading when the user tries to interact with the site.
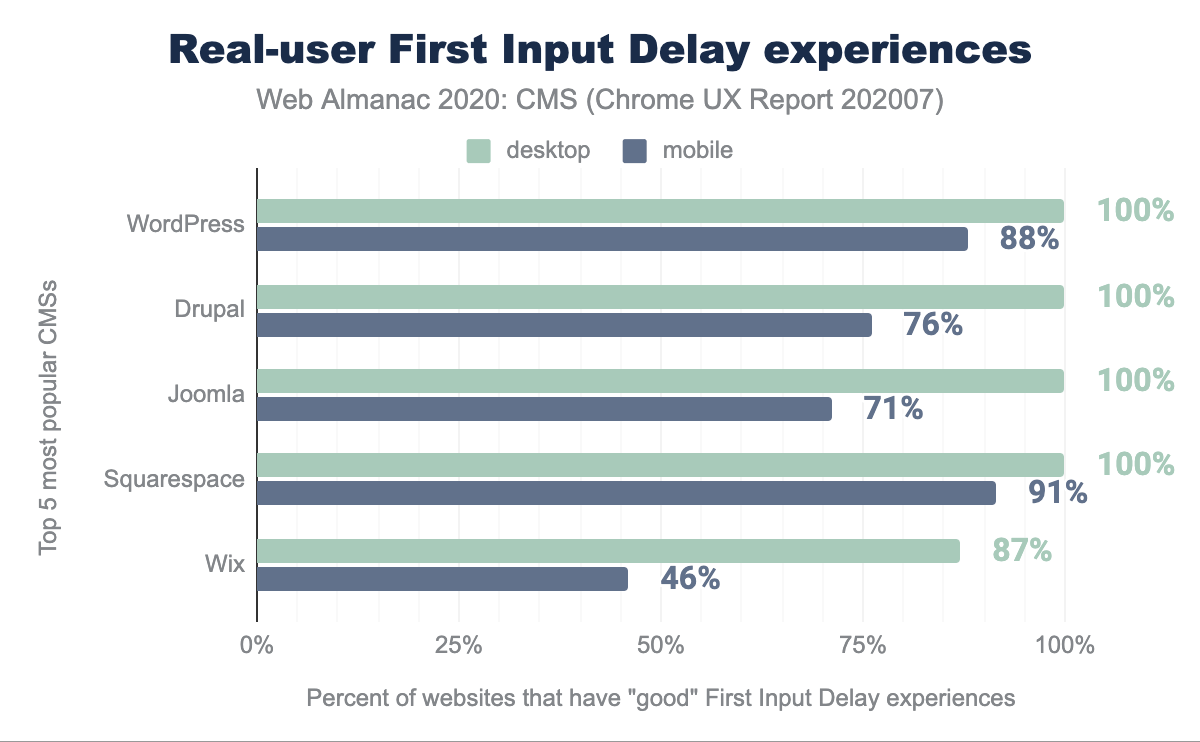
FID is very fast for the average CMS website on desktop–only Wix scores lower than 100%–and mixed on mobile. Most CMSs deliver mobile FID on an average site within a reasonable range of the desktop score. For Wix the number of websites that have a good FID on mobile is nearly half the desktop total.
The FID scores are generally good here, in contrast to the LCP scores. As suggested, the weight of individual pages on CMSs in addition to mobile connection quality or the lower performance of mobile devices relative to desktop, could play a role in the performance gaps that we see here affecting FID less.
There is a small margin of difference between the resources shipped to desktop and mobile versions of a website. Last year we noted that optimizing for the mobile experience was necessary. Average scores have increased on desktop and mobile, but further attention is required on mobile.
Cumulative Layout Shift
Cumulative Layout Shift (CLS) measures the instability of content on a web page after the first 500ms of user input, and after the first user input. This is important on mobile in particular, where the user will tap where they want to take an action–such as a search bar–only for the location to move as additional images, ads, or similar load.
A score of 0.1 or below is measured as “good”, over 0.25 is “poor”, and anything in between is “needs improvement”.
The top 5 CMSs could improve here. Only 50% of web pages loaded by a top 5 CMS have a “good” CLS experience, with this figure rising to 59% on mobile. Across all CMSs the average desktop score is 59% and average mobile score is 67%. This shows us all CMSs have work to do here, but the top 5 CMSs in particular need improvement.
Lighthouse scores
Lighthouse is an open-source, automated tool designed to help developers assess and improve the quality of their websites. One key aspect of the tool is that it provides a set of audits to assess the status of a website in terms of performance, accessibility, SEO, progressive web apps, and more. For this year’s chapter, we looked at two specific audits categories: SEO and accessibility.
SEO
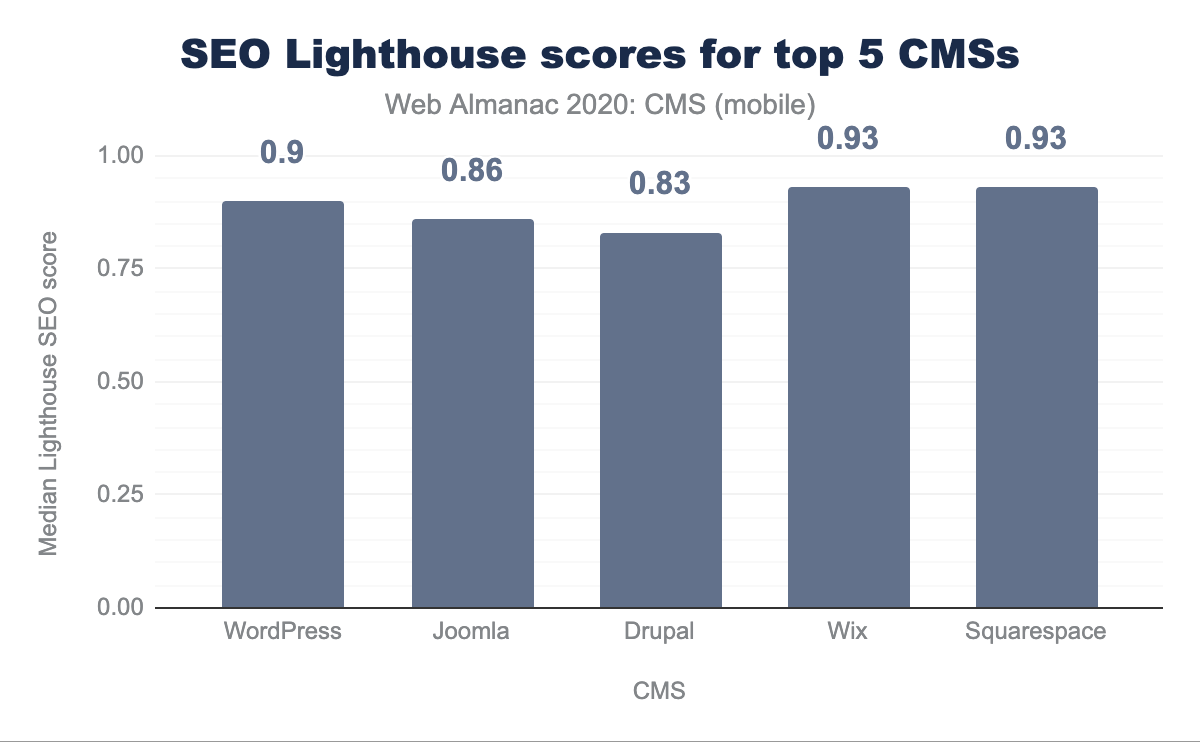
Search Engine Optimization (or SEO) is the practice of optimizing websites to make your website content more easily found in search engines. This is covered in more in depth in our SEO chapter, but one part involves ensuring the site is coded in such a way to serve as much information to search engine crawlers to make it as easy as possible for them to show your site appropriately in search engine results. Compared to a custom created website, you would expect an CMS to provide good SEO capabilities, and the Lighthouse scores in this category show high marks:
All of the top 5 CMSs score highly here with median scores of 0.83 or above, with some reaching as high as 0.93. SEO can depend on the website owner making use of capabilities of a CMS but making those options easy to use in a CMS, and good defaults, can have big benefits for sites run on those CMSs.
Accessibility
An accessible website is a site designed and developed so that people with disabilities can use them. Web accessibility also benefits people without disabilities, such as those on slow internet connections. A full discussion can be seen here, and in our Accessibility chapter.
Lighthouse provides a set of accessibility audits and it returns a weighted average of all of them (see Scoring Details for a full list of how each audit is weighted).
Each accessibility audit is either a pass or a fail, but unlike other Lighthouse audits, a page doesn’t get points for partially passing an accessibility audit. For example, if some elements have screen reader-friendly names, but others don’t, that page gets a 0 for the screen reader-friendly-names audit.
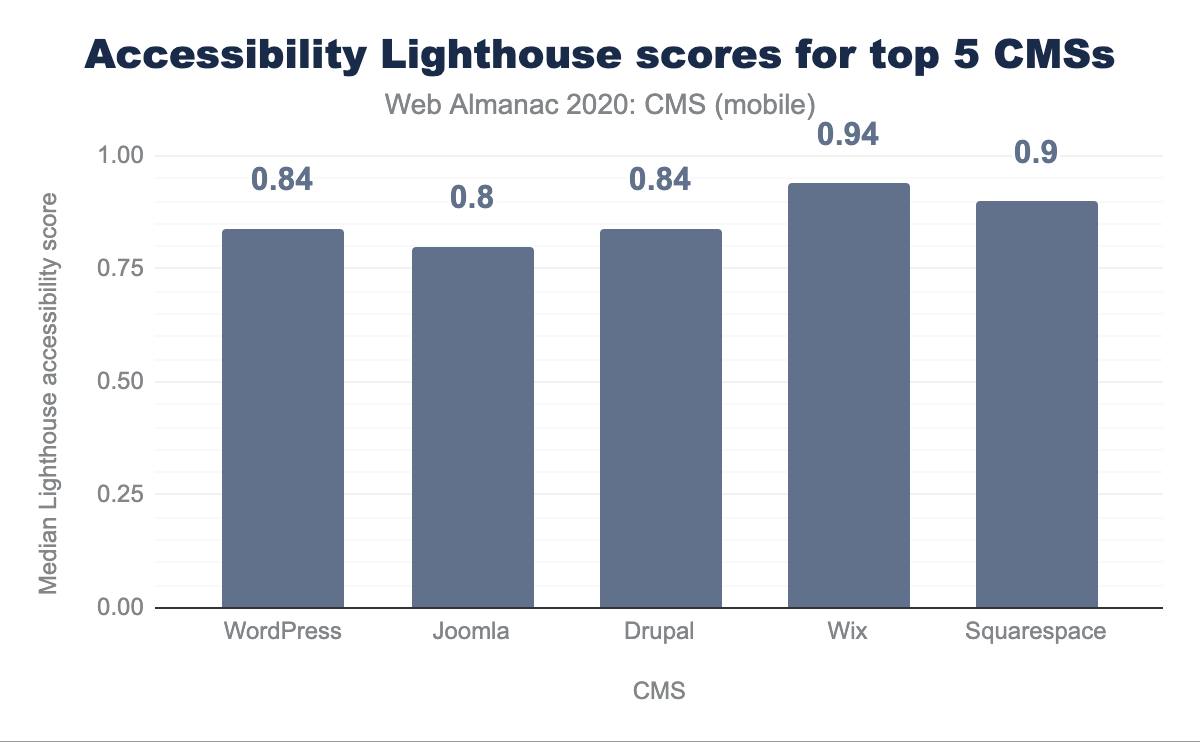
The median Lighthouse accessibility score for the top 5 CMSs is all above 0.80. Across all CMSs, the average median Lighthouse score is 0.78, with a minimum of 0.44 and a maximum of 0.98. We thus see that the top 5 CMSs are better than average, with some better than others. Wix and Squarespace have the highest scores of the top 5. Possibly these platforms being proprietary helps here, as they’re able to control the sites which are created more closely.
The bar should be higher here, though. An average score of 0.78 across all CMSs still leaves significant room for improvement, and the maximum score of 0.98 shows even the “best” CMS for accessibility compliance has room for improvement. Improving accessibility is essential and urgent work.
Environmental impact
This year we’ve sought to better understand the impact of CMSs on the environment. The information and communications technology (ICT) industry accounts for 2% of global carbon emissions, and data centers specifically account for 0.3% of global carbon emissions. This puts the ICT industry’s carbon footprint equivalent to the aviation industry’s emissions from fuel. We don’t have data on the role of CMSs here, but with our research showing 42% of websites use a CMS, it is clear CMSs play an important role in the efficiency of websites and their impact on the environment.
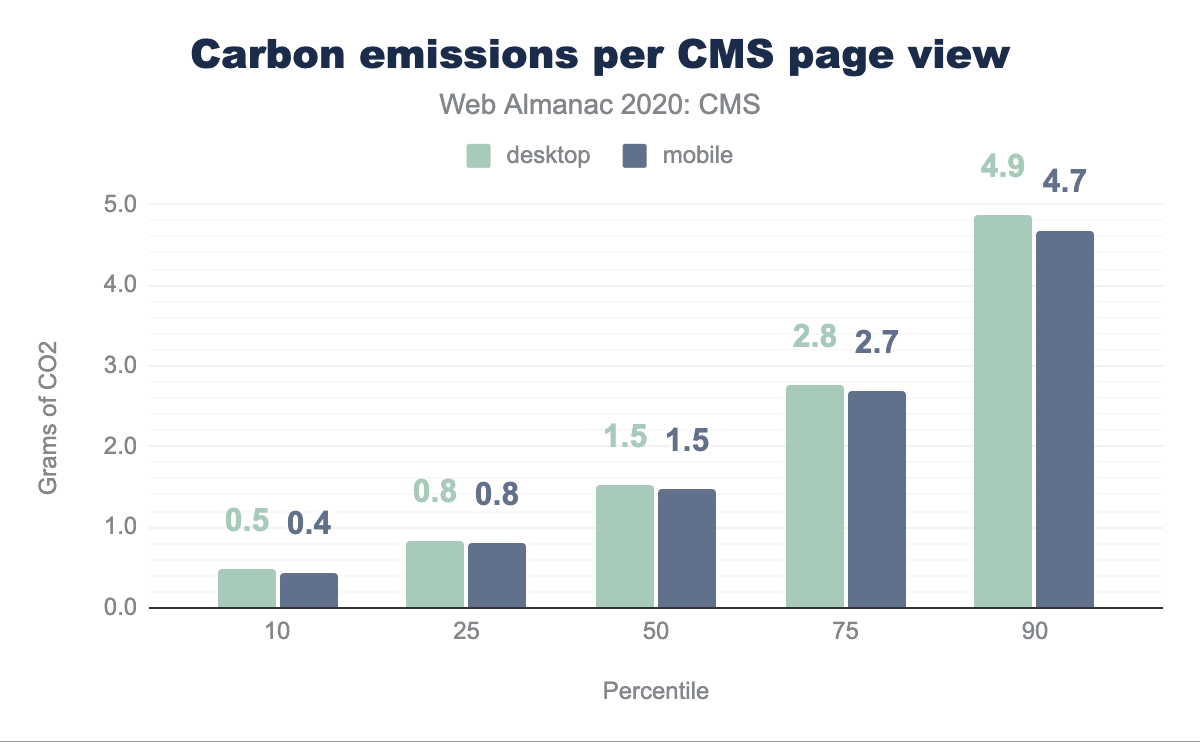
Our research looked at the average CMS page weight in KB and mapped this to CO2 emissions using logic from carbonapi. This generated the following results, split by desktop and mobile:
We found that the median CMS page load resulted in the transfer of 2.41 MB and thus the emission of 1.5g of CO2. This was the same for desktop and mobile. The most efficient percentile of CMS web pages result in the generation of at least one third less CO2, whilst the least efficient percentile of CMS web pages goes the other way: over one third less efficient than the median. The most efficient percentile of pages is approximately ten times more efficient than the least efficient percentile.
CMSs power every type of website, so this discrepancy is not surprising. CMSs can, however, influence at the platform-level the efficiency of websites they create.
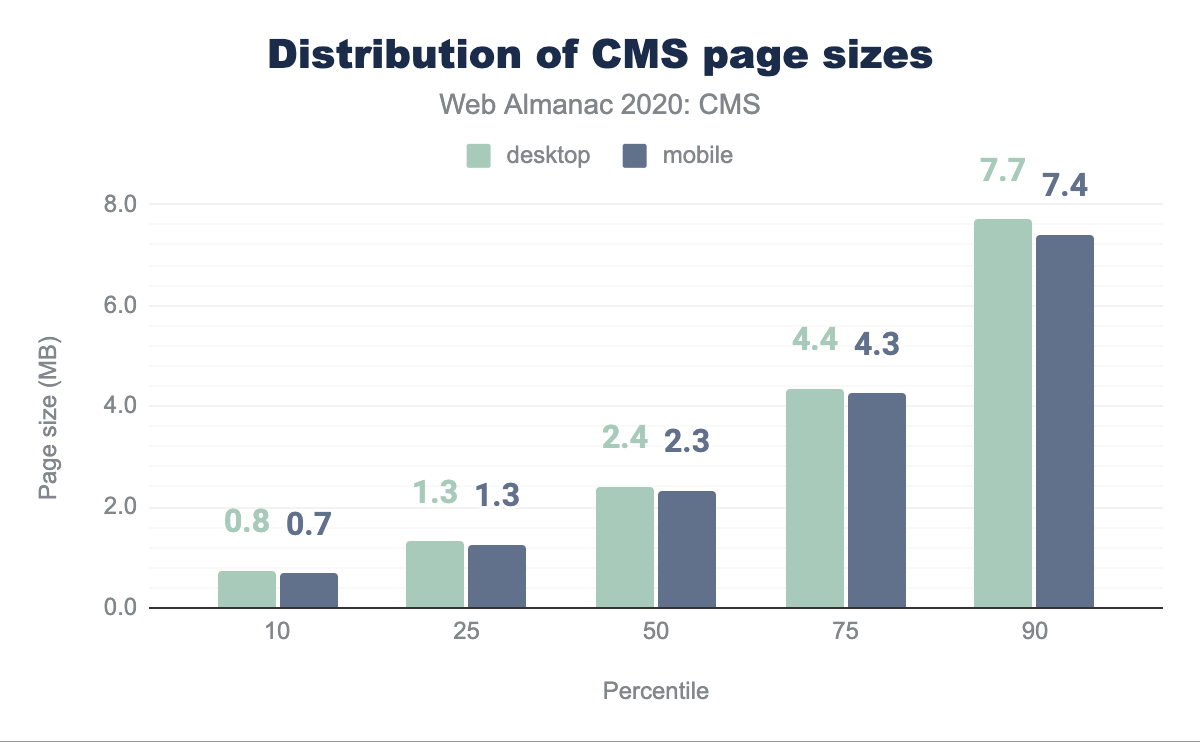
Page weights are important here. The average desktop CMS web page loads 2.4 MB of HTML, CSS, JavaScript, media, etc. 10% of pages, however, load over 7 MB of this data. On mobile devices the average web page loads 0.1 MB fewer than on desktop, with at least this number being true across all percentiles:
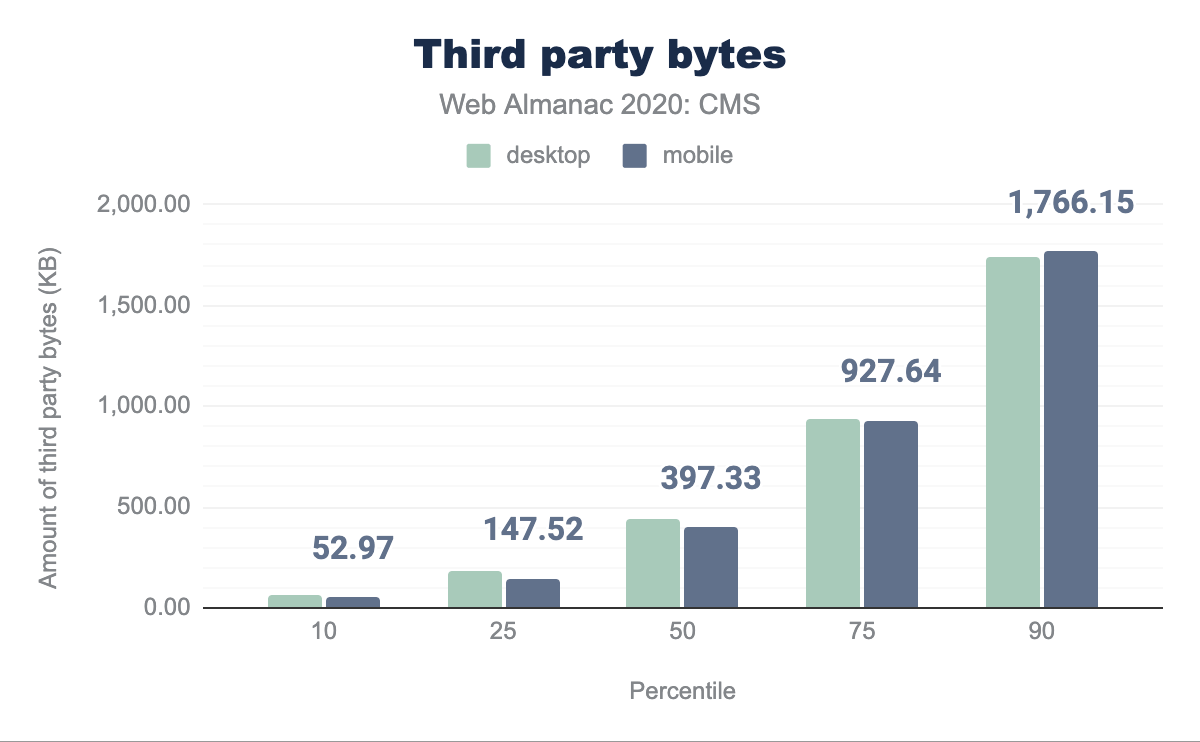
CMS often load third party resources, such as external images, videos, scripts, or stylesheets:
We find that the median desktop CMS page has 27 third-party requests with 436 KB of content, with the mobile equivalent generating 26 requests with 397 KB of content.
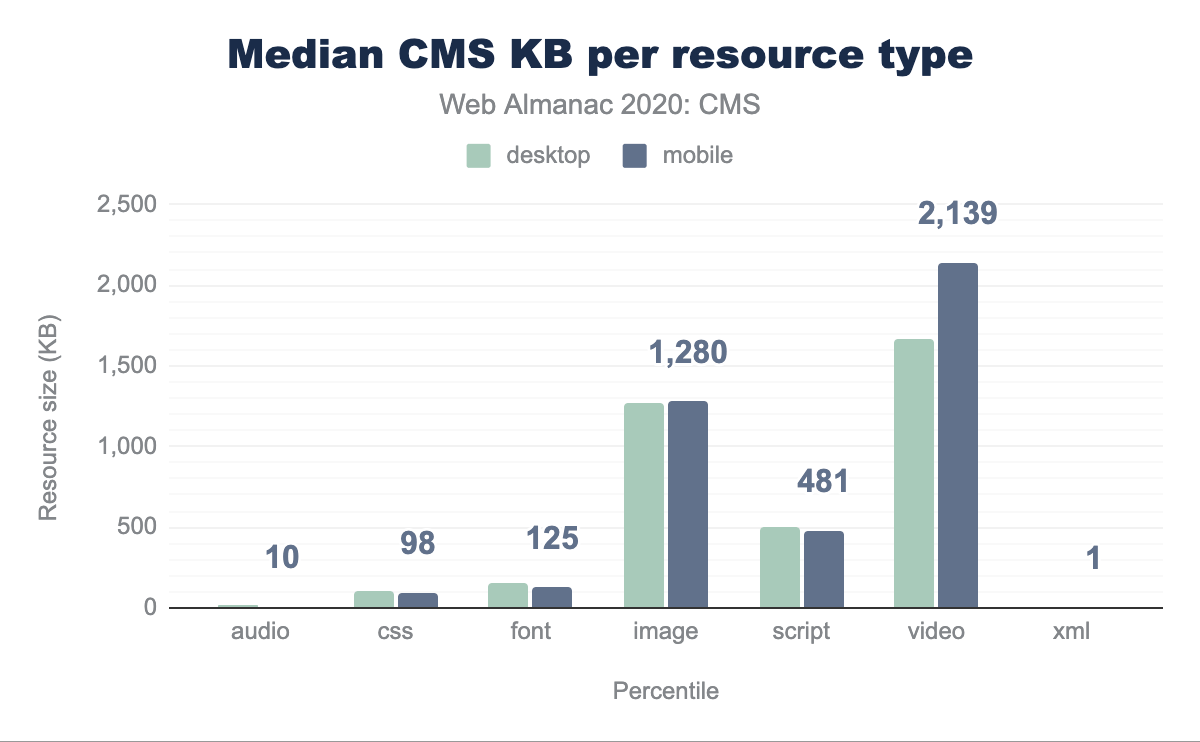
One of the main ways a CMS can influence its page load size is by supporting and encouraging the usage of more efficient formats. Images are behind only video in their contribution to page weight.
Video contributes a larger percentage per resource type here. Making video more efficient, or other mechanisms such as the impact of stopping autoplay, are interesting areas for future research. Here our focus is on images. Popular image formats are JPEG, PNG, GIF, SVG, WebP, and ICO. Of these, WebP is the most efficient in most situations, with WebP lossless images 26% smaller than equivalent PNGs and 25-34% smaller than comparable JPGs. We see, however, that WebP is the second least popular image format across all CMS pages:
Of the top 5 CMSs, only Wix automatically converts and serves images in the WebP format. WordPress, Drupal, and Joomla support WebP with extensions, whilst at the time of writing Squarespace does not support WebP.
As we saw earlier, Wix had the lowest proportion of sites with a “good” LCP. While we know that Wix is making efficient use of image bytes in WebP, there are clearly other issues affecting its LCP performance beyond image formats that we aren’t controlling for here. WebP is, however, a more efficient format and improved native support for the format by the most popular CMSs would be beneficial.
Image formats are one mechanism for making images more efficient. Other mechanisms such as “lazy loading” images would benefit from future research.
We’re unable to fully answer the question of the impact of CMSs on the environment, but we are contributing to an answer. CMSs have a responsibility to take environmental impact seriously and decreasing the average page weight is important work.
Conclusion
CMSs have only gotten more important in the last year. They are essential for how content is created and consumed on the internet, and there are no signs that this will change in the foreseeable future. CMSs are set to become more important with each year passing.
We have reviewed the adoption of CMSs, user experience of websites created by these CMSs, and for the first time looked at the impact of CMSs on the environment. We have answered many questions here but leave further questions unanswered. Further research building on this chapter will be gratefully received. We have also highlighted some areas which need attention by the CMSs. We hope there will be progress to share in the 2021 report.
CMSs are vital for the success of the internet and open web. Let’s work towards continued progress.

